One number, one source
Why it matters
ARR, renewals, usage, debtors: every figure on every page and in every chat answer is computed once, from one set of facts, so the site, the chat and your reports agree.
The facts are built inside your own Snowflake from your systems' exports, so your data stays where it is and B-Brain works on top of the warehouse you already run.
Where the systems themselves disagree, such as invoiced ARR against the CRM, B-Brain shows the reconciliation rather than quietly picking a winner.
See it in the demo
See it working
The same facts drawn three ways: on a page, in a chat answer and in a file the brain made.
The Commercial Dashboard

Every kpi from one set of facts: ARR, retention, margins and efficiency, each against its target.
Hover a tile for the figure in full; click through to the trend.
Board deck, Q3 2026
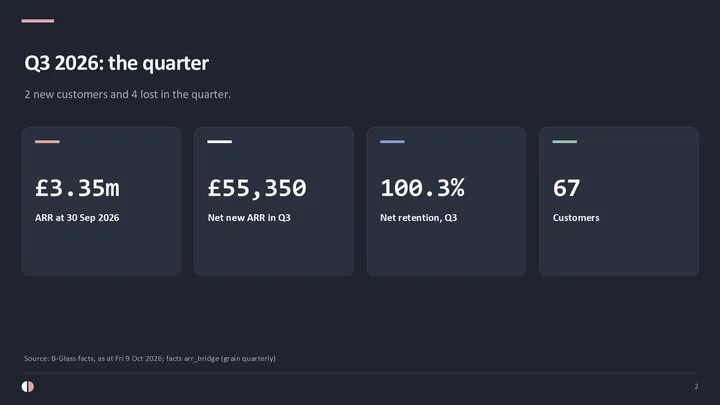
The same facts in a file: a slide of the board deck B-Brain made from one question, each figure naming its source.
Open it on the Examples page, with the chat behind it and the .pptx to download.
Ask B answers, with its chart

A real answer: who is under-using the seats they pay for, read from the usage facts, with its source, its chart and the receipt.
Ask your own: the bubble in the header opens Ask B on any page.
Reconciliation

Invoiced ARR against the CRM, the difference explained line by line.
Hover a bar for the organisations behind it.